Solana forms ‘bullish megaphone’; Analyst sets key SOL levels to watch
Although Solana (SOL) and the general crypto market are witnessing a capital outflow, an analyst has pointed out that the decentralized finance (DeFi) asset is facing general bullish sentiments.
Particularly, in an X post on August 1, Ali Martinez pointed out that Solana appears to be forming a bullish megaphone pattern on its four-hour chart.
Notably, the bullish megaphone pattern is characterized by higher highs and lower lows, forming a widening wedge. This pattern is typically indicative of increasing volatility and a potential bullish breakout.
Picks for you
Martinez highlighted the importance of the 61.8% Fibonacci retracement level, which SOL recently corrected. This level, located around $161.92, is often viewed as a critical support zone, suggesting a potential rebound.
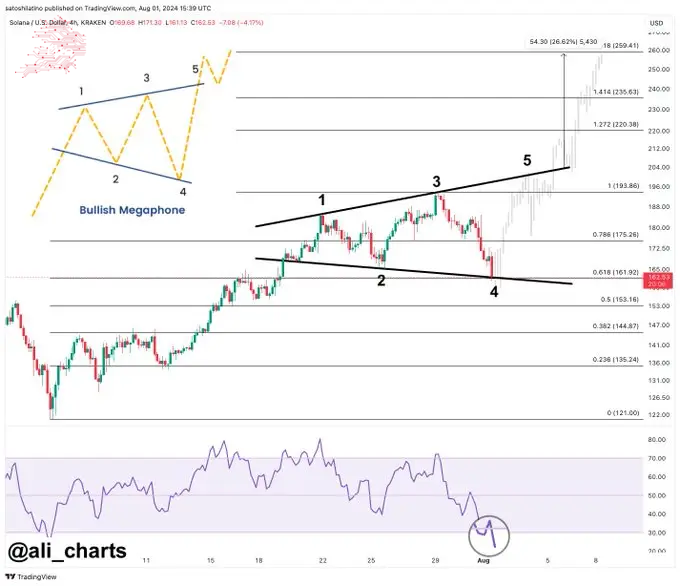
The four-hour chart’s Relative Strength Index (RSI) shows oversold conditions, reinforcing the idea that Solana might be poised for a rebound. Notably, an oversold RSI often indicates that the selling pressure may wane, and a price reversal could be on the horizon.
SOL’s key levels to watch
Based on Martinez’s Analysis, he suggested that traders might consider the current dip to the 61.8% Fibonacci level as a good time to buy SOL. To manage risk, he advises placing a stop-loss around $156-$154, just below the current support level, providing a buffer against further downward movement.
For potential gains, he sets a take-profit target between $200 and $259. These levels align with the upper boundary of the bullish megaphone pattern and the 1.272 and 1.414 Fibonacci extension levels.
Initially, Martinez had maintained that Solana’s long-term bullish projection would see the token rally to a record of $1,000.
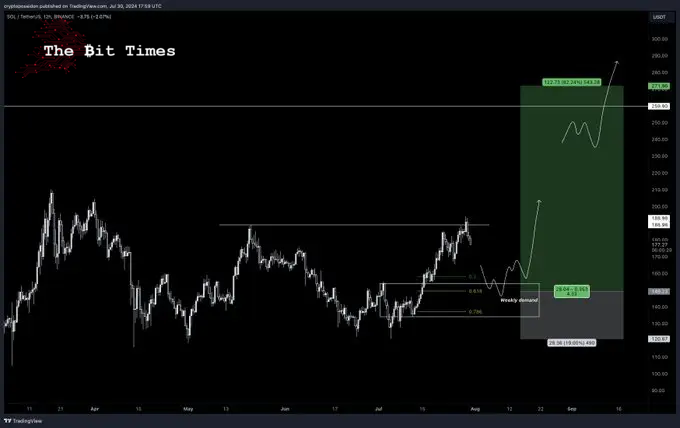
In another Analysis, a crypto expert with the pseudonym CryptoPoseidonn suggested that Solana might experience further sell-off in the coming days. According to the analyst, investors should expect a drop to around $150, likely offering a new buying opportunity. He projected that the token might rise to $500.
SOL price analysis
At press time, Solana was trading at $163, with losses of over 3% in the last 24 hours. On the weekly chart, SOL is down over 8%.
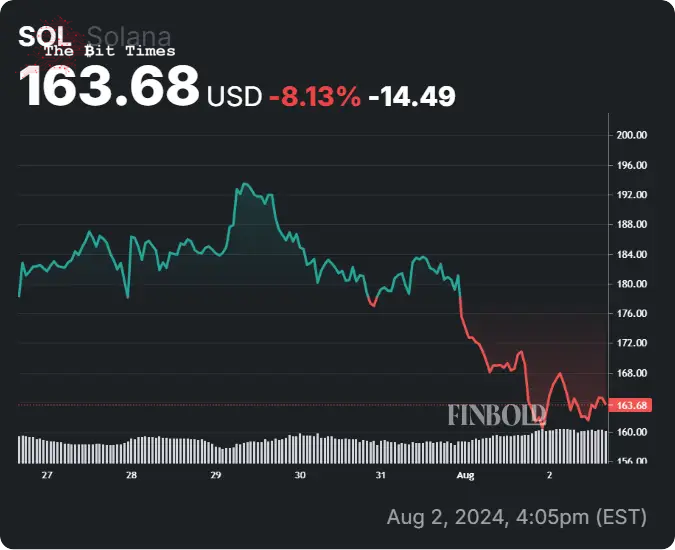
In addition to the price levels suggested by Martinez, investors should also watch for immediate support and resistance levels for SOL, which stands at $160 and $165, respectively.
Disclaimer: The content on this site should not be considered investment advice. Investing is speculative. When investing, your capital is at risk.


Comments
Post a Comment