Ripple Coin Continues Its Rise, But Tests The High Of $0.64

The price of Ripple (XRP) has been fluctuating between the moving average lines since March 16, 2024. Price fluctuation details in the price Analysis by Coinidol.com.
XRP long-term analysis: bearish
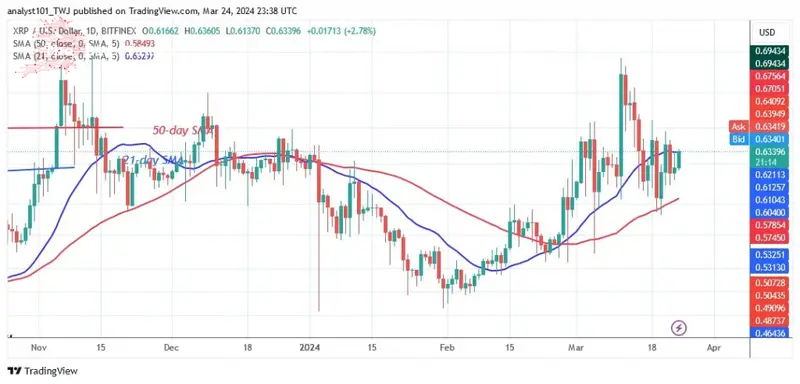
Buyers made three unsuccessful attempts to hold the price above the 21-day SMA but failed. The price of the cryptocurrency is currently close to the 21-day SMA and is on the verge of breaking it. Every time the 21-day SMA is breached, the price falls below it. If the buyers are successful, XRP will rise back to its previous high of $0.74.
On the downside, the bulls have kept the price above the 50-day SMA or the $0.588 support. The cryptocurrency is now worth $0.633 at the time of writing.
XRP indicator analysis
XRP has been stuck between the 21-day and 50-day SMA for the past week. There has been no movement in the price of the altcoin over the past week. The altcoin shows a trend when it breaks above the moving average lines. Currently, the moving average lines are trending upwards, indicating the previous trend.
Technical indicators:
Key resistance levels – $0.80 and $1.00
Key support levels – $0.40 and $0.20

What is the next direction for XRP?
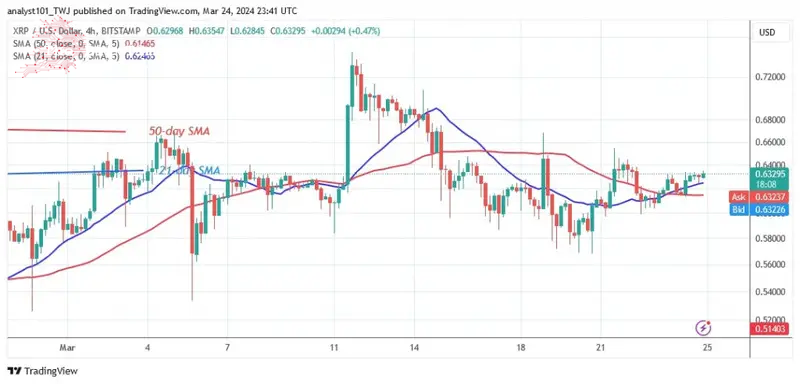
The altcoin has been trading within a range over the past week. The price of the altcoin oscillated above the support level of $0.588 and the resistance level of $0.633. The price movement on the 4-hour chart was subdued due to the doji candlesticks.

Disclaimer. This Analysis and forecast are the personal opinions of the author and are not a recommendation to buy or sell cryptocurrency and should not be viewed as an endorsement by CoinIdol.com. Readers should do their research before investing in funds.
Comments
Post a Comment